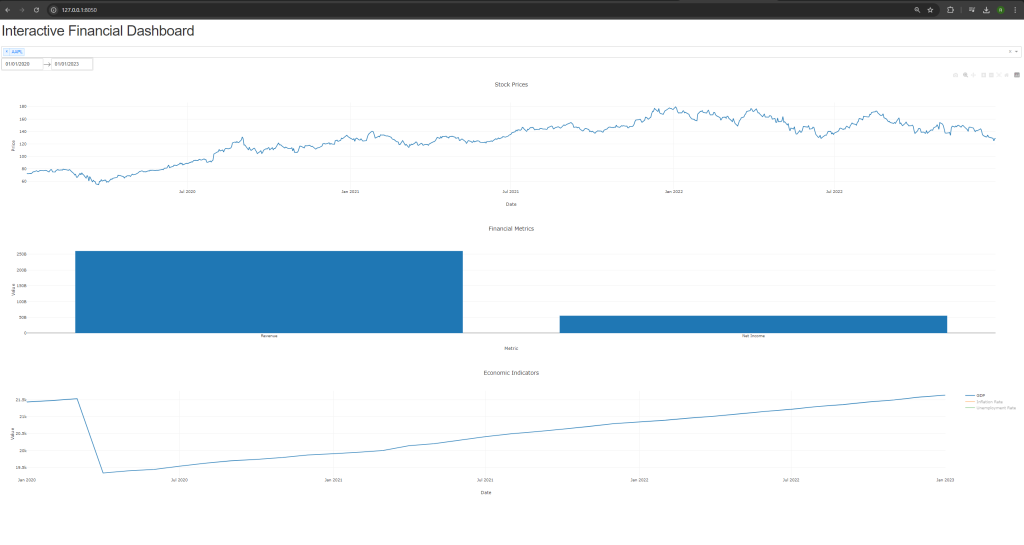
This script sets up an interactive financial dashboard using Python and several powerful libraries. It begins by importing essential libraries, including yfinance for fetching stock data, pandas for data manipulation, and dash along with plotly for creating interactive visualizations. The data collection step involves defining a function, fetch_historical_data, which retrieves historical stock prices for specified tickers from Yahoo Finance. Additionally, financial statements and economic indicators are read from CSV files, with date columns converted to datetime format for proper handling.
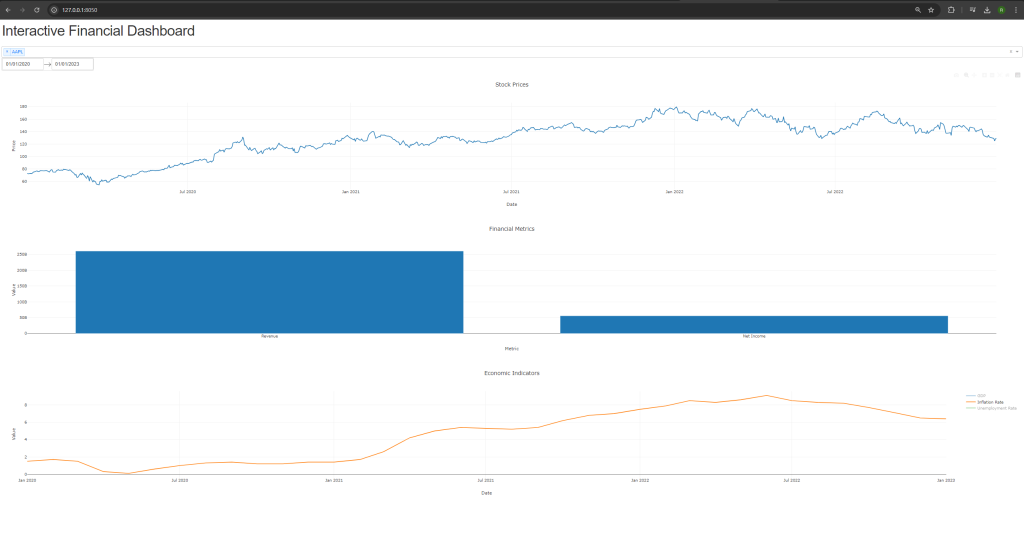
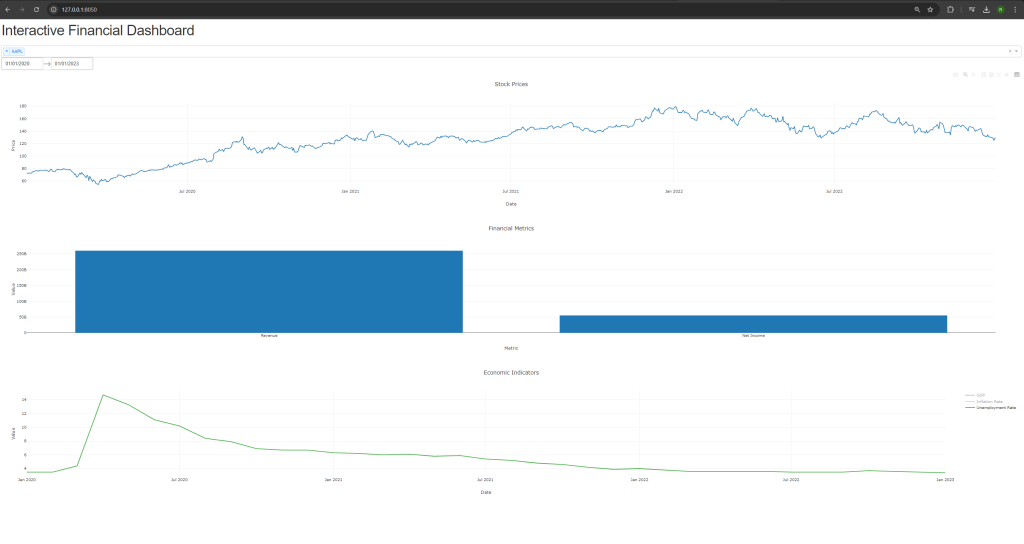
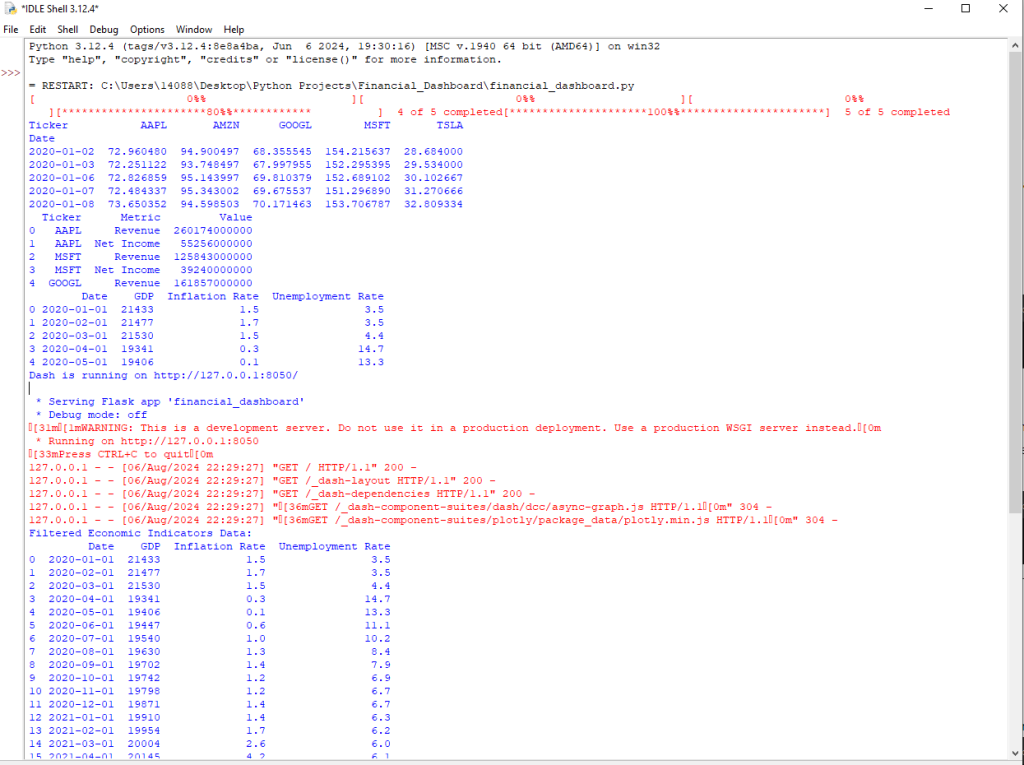
To ensure the data is correctly loaded, the script prints the first few rows of the price data, financial statements, and economic indicators. The dashboard creation step involves setting up a Dash application layout that includes dropdown menus for selecting stocks, a date picker for specifying the date range, and placeholders for displaying various graphs. The dashboard features three primary visual components: a stock price chart, a financial metrics chart, and an economic indicators chart.
The script uses callbacks to update these charts dynamically based on user inputs. The stock price chart updates when the user selects different tickers or date ranges. The financial metrics chart adjusts according to the selected tickers, and the economic indicators chart updates based on the chosen date range, with intermediate data prints for debugging purposes. Finally, the script runs the Dash server, making the interactive dashboard accessible to users. This setup allows for real-time visualization and analysis of stock prices, financial metrics, and economic indicators, providing a comprehensive tool for financial analysis.


