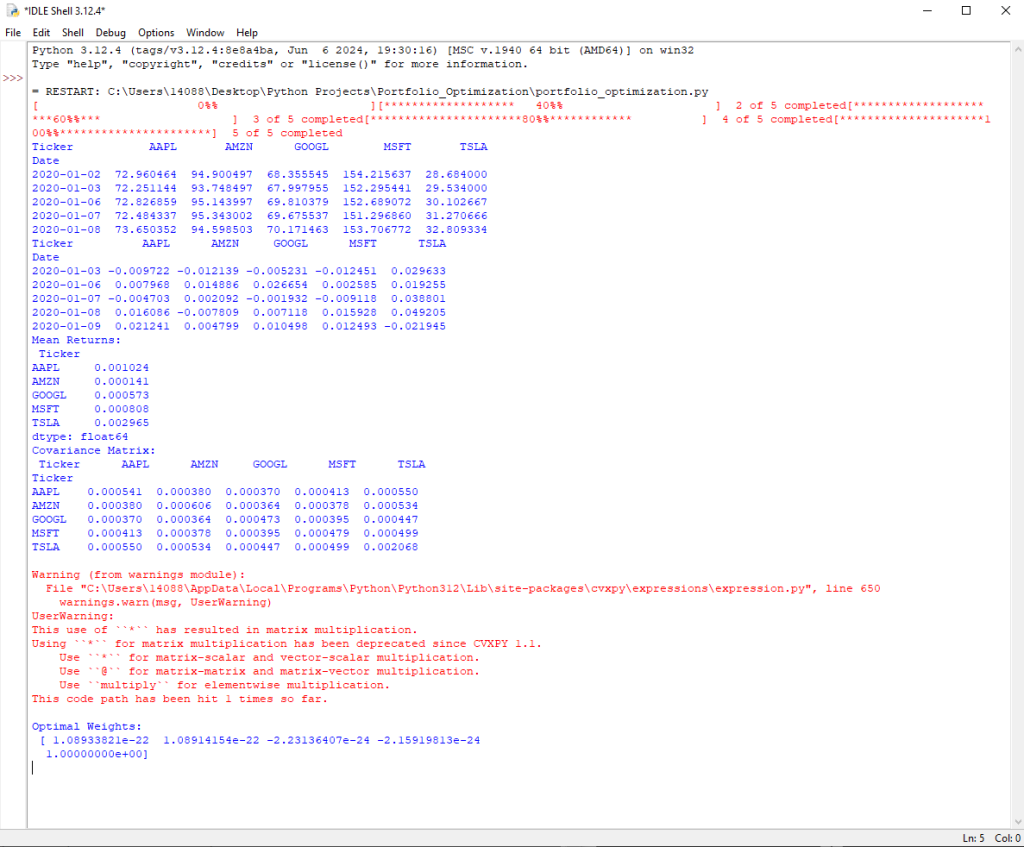
This script sets up a portfolio optimization and visualization system using Python. It begins by importing essential libraries, including yfinance for fetching stock data, pandas and numpy for data manipulation, cvxpy for convex optimization, and matplotlib for data visualization. The data collection step involves defining a function, fetch_historical_data, which retrieves historical adjusted close prices for specified tickers over a specified date range using the Yahoo Finance API.
The return calculation step involves computing the daily returns from the adjusted close prices. In the risk and return analysis step, mean returns and the covariance matrix of the returns are calculated. These metrics are essential for understanding the expected performance and risk of the assets.
The optimization model step involves defining a function, optimize_portfolio, which uses convex optimization to determine the optimal weights of the assets in the portfolio that maximize the risk-adjusted return (Sharpe ratio). The model takes into account the mean returns, the covariance matrix, and a risk-free rate.
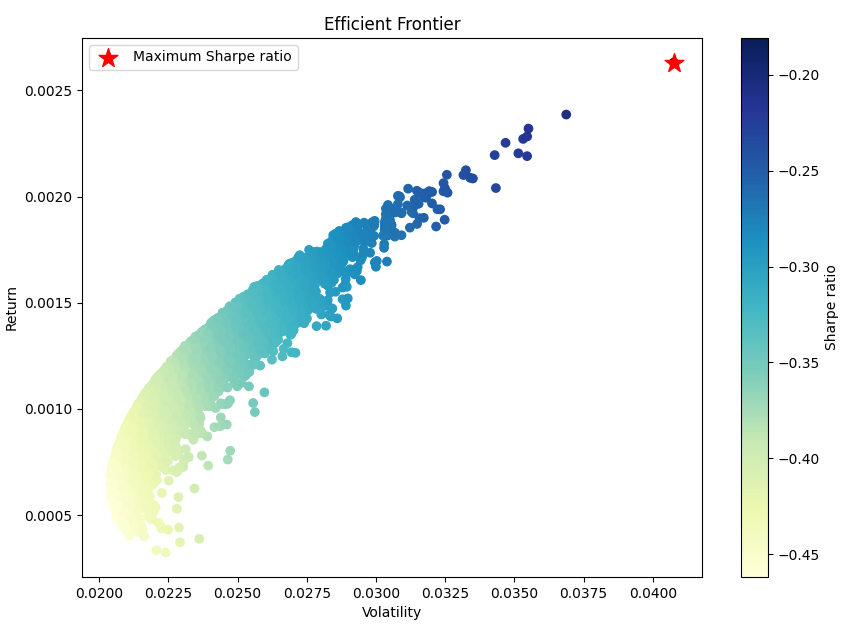
For visualization, a function, plot_efficient_frontier, is defined to simulate a large number of random portfolios, calculate their returns and standard deviations, and plot the efficient frontier. The efficient frontier represents the set of optimal portfolios that offer the highest expected return for a given level of risk. The script also highlights the portfolio with the maximum Sharpe ratio on the plot.
The script concludes by calling the functions to fetch the data, calculate returns, analyze risk and return, optimize the portfolio, and visualize the efficient frontier, providing a comprehensive tool for portfolio optimization and analysis.


